


My electricity provider uses ZigBee devices, so I was hoping to consume this data directly from the electric meter without touching the circuit board. A recent article on the Grafana blog caught my attention because the author was using a very similar stack to mine including a custom Home Assistant integration.
The only thing missing was the device that can bridge Home Assistant and my electric meter. The author was using an Emporia energy monitor which seemed to have fairly positive reviews and was simple to install. I decided to go with the Vue Utility Connect ($39) which communicates with supported electric meters over ZigBee. There is also a more advanced version that connects to your circuit board and monitors individual devices.
Installation process

The installation was fairly straightforward. You need to find an electric socket nearby your utility meter, plug in Emporia Vue Utility Connect, and tell your utility provider to stream data into your device. This is usually done using the Mac address printed on the back of the device. Emporia has a detailed guide for every supported electricity provider.
As a next step, download the Emporia Energy app, wait for it to connect to your device and input your Wifi credentials. If everything is connected properly, you should be able to see real-time energy monitoring in the Emporia app.
Now let’s connect Emporia to Home Assistant. Unfortunately, there is no official integration yet, so you will have to install a custom component using HACS. After restarting your Home Assistant instance, you should be able to see Emporia Vue in the default integration menu and set up the component there. Unfortunately, there is no local API for Emporia, so this component is using your cloud credentials to call on Emporia’s cloud API. In my testing so far that has not been an issue, but hopefully, Emporia will add local API at some point.
The custom component creates few entities with odd names, so make sure you rename them into something user-friendly. In my case, I got 3 sensors – sensor.power_1min, sensor.power_1day and sensor.power_1month.
Home Assistant energy monitoring card
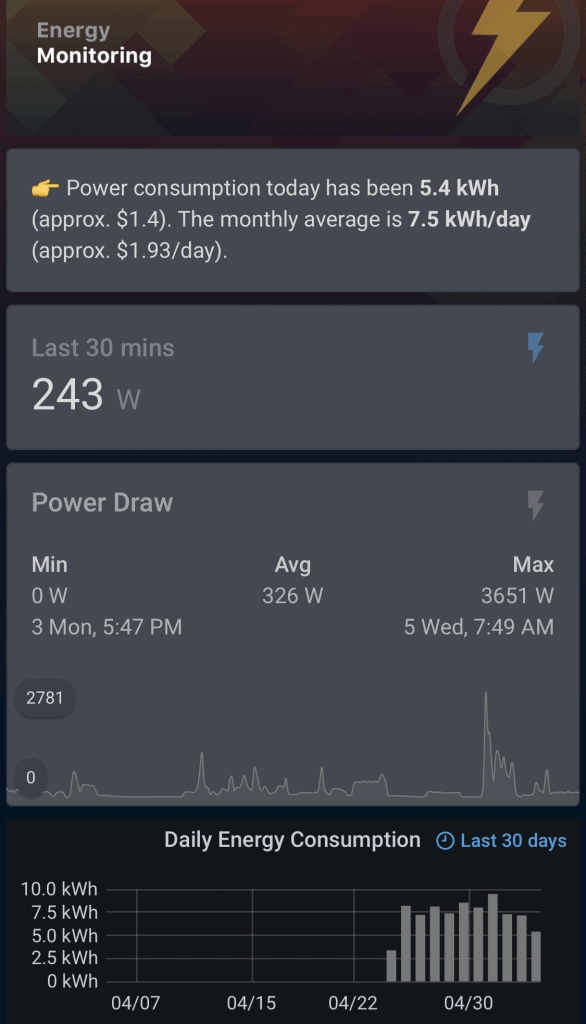
Once you have your sensors set up, it is fairly easy to expose the information in Home Assistant using Lovelace UI. Here is an example of my energy monitoring page.
Summary (Markdown card)
The integration resets the daily and monthly sensors to zero at the end of each period. If you are trying to calculate the daily average, you need to divide the monthly sensor by today’s date (sensor.day_number). Also, I am using $0.259 as my price per kWh, so update that number to your situation.
content: >

{{ "\uD83D\uDC49" }} Power consumption today has been {{
states('sensor.power_1day')|float|round(1) }} kWh (approx. ${{
(states('sensor.power_1day')|float*0.259)|round(2)}}).

The monthly average is {{((states('sensor.power_1month')|float) / (states('sensor.day_number')|float))|round(1)}} kWh/day (approx. ${{(((states('sensor.power_1month')|float) / (states('sensor.day_number')|float))|float*0.259)|round(2)}}/day).

show_header_toggle: false
type: markdown
30 min average energy usage (Statistics sensor)
I found the 1-min sensor in my case as very hard to interpret since it often jumps between high and low values. In order to normalize this figure, I created a new sensor in my sensor.yaml file. This sensor uses built-in platform statistics and calculates mean based on last 30 values of the 1-min sensor.
  - platform: statistics
    entity_id: sensor.power_1min
    precision: 0
    name: Power 30min
    sampling_size: 30
    max_age:
      minutes: 30
48-hour chart (custom mini-graph-card)
I am using a custom card called mini-graph-card to show the 1-min sensor data over the last 48 hours. You can of course use the default Lovelace chart to achieve a similar result.
color_thresholds_transition: smooth
decimals: 0
show:
  extrema: true
  average: true
  state: false
entities:
  - aggregate_func: avg
    entity: sensor.power_1min
    show_points: false
height: 120
hours_to_show: 48
icon: 'mdi:flash'
name: Power Draw
points_per_hour: 6
line_width: 1
lower_bound: 0
type: 'custom:mini-graph-card'
Monthly view (Grafana chart)
Finally, I am using a chart from my Grafana instance to display the long-term data. You can do this simply by using the embed link from Grafana as a webpage in Home Assistant.
UPDATE – AUGUST 2021
Home Assistant has introduced new energy management features in version 2021.8.0. The custom component (v0.6.0) for Emporia Energy has been recently updated to support this functionality.


I cannot seem to get Emporia to show up in the Configuration/Integrations section of HA. I’ve recently updated to 2021.6.2, so I’m wondering if something changed since you got yours setup. I can see the files have been added to “custom_components” but no joy on the integrations.
Hi, sorry for the late reply. It is still working on my end – have you installed the custom integration using HACS? That’s usually the safer way.
Thank you very much for this post. I could not find any instruction to add Emporia Vue to Home Assistant. The process is complicated since I am new to HACS. I like to learn how to do it. I will give it a try as soon as I get some free time to play with electronic stuff. Thanks again for this article!
HACS is actually fairly easy to learn and it makes custom component management and updates simple. I would definitely recommend it.
I just installed the emporia integration in home assistant. I’m only seeing three devices; minute, day, month? How can I get it to show the individual sensors (16 50a clamps or two main clamps)? Thanks